Overview
This is a protocol for generating RAD libraries for Illumina sequencing. With this technique, 96 samples can be multiplexed into one sequencing library, and only tags adjacent to PstI sites are sequenced. This is a cheap way to both mine and genotype large numbers of SNPs.
Materials
Reagents
- Quant-iT Picogreen kit (Invitrogen)
- Qiagen gel purification kit
- Qiagen PCR cleanup kit
- From New England Biolabs:
- PstI-HF, 20,000 U/mL
- MspI, 20,000 U/mL
- T4 DNA ligase, 2,000,000 U/mL
- ATP
- KAPA HiFi Library Amplification Kit, without primers. In the past we used Phusion High Fidelity PCR master mix from NEB, but KAPA is supposed to be better.
- 100 bp DNA ladder
- Gel loading dye that does NOT have bromophenol blue. Currently we use a home-made loading dye with Orange G, glycerol, and TE. NEB also makes an orange loading dye that works well. I have also used Promega GoTaq Green PCR buffer as a loading dye.
- You will also need a black microtiter plate for the Picogreen assay.
Note: Although MspI and PstI are not completely inactivated by heat, the adapters are designed such that the restriction cut sites are not recreated by the ligation reaction. The final ligated products will therefore not be re-digested.
Note #2: To mine additional genomic positions, additional libraries can be made in which PstI-HF is replaced with NsiI-HF. These two enzymes have the same overhang, and therefore the same adapters can be used. The nucleotides flanking the overhang are different between these two enzymes, and therefore they cut at different sites. With NsiI, if using adapters designed for PstI, some of the adapters will recreate the restriction cut site, and so care must be taken to deactivate the enzyme with the heat inactivation step.
Note #3: To mine a much smaller number of genomic positions at much greater read depth, PstI-HF can be replaced with SbfI.
Oligonucleotides
PstI adapters
This is the most expensive part of the protocol other than the sequencing itself, since 192 oligonucleotides must be ordered.
Adapter 1 top: 5'GATCTACACTCTTTCCCTACACGACGCTCTTCCGATCTxxxxTGCA3'
Adapter 1 bottom: 5'yyyyAGATCGGAAGAGCGTCGTGTAGGGAAAGAGTGTAGATC3'
Where xxxx
and yyyy
are the barcode and its reverse complement, respectively.
Barcodes and oligo sequences are from Pat Brown’s lab (Thurber et al. 2013).
Media:PstI-barcodes.txt
More recently (April 2015) we designed new PstI adapters ranging from six to ten nucleotides long using Deena Bioinformatics.
Other oligos
MspI adapters:
- A2top:
5'CGCTCAGGCATCACTCGATTCCTATCAGAACAA3'
- A2bot:
5'CAAGCAGAAGACGGCATACGAGATAGGAATCGAGTGATGCCTGAG3'
Note that the MspI adapter sequences were changed in September 2017 to be compatible with the HiSeq 4000.
Illumina PCR primers:
- PCR1:
5'AATGATACGGCGACCACCGAGATCTACACTCTTTCCCTACACGACGCTCTTCCGATCT3'
- PCR2:
5'CAAGCAGAAGACGGCATACGA3'
Equipment
- Nanodrop spectrophotometer
- BioTek Synergy plate reader (for reading fluorescence)
- Ordinary PCR machine
- Agarose gel rig
- UV transilluminator for gel excision
- Bioanalyzer
- real-time PCR machine (we just pay the core facility to do that part)
Procedure
Adapter prep
Top and bottom strands of adapters need to be annealed 1X Annealing Buffer, which is 10 mM Tris, 50 mM NaCl.
The annealing program is:
- 95°C 5 minutes
- Ramp down -0.1°C every 2 seconds (or -1°C every 20 seconds) to 25°C.
My protocol:
- We have a stock plate of PstI adapters that are at 1 μM. I took a bottle of autoclaved 1X Annealing Buffer, added 45 μl to each well of a 96-well plate, then transferred 5 μl from the 1 μM plate to make a 0.1 μM working stock.
- MspI adapters are ordered like normal oligos, and I have 100 μM concentrated stocks in TE. To make a 10 μM stock:
- 20 μl A2top, 100 μM
- 20 μl A2bot, 100 μM
- 20 μl 500 mM NaCl
- 2 μl 1M Tris
- 138 μl nuclease-free water
- Mix well, add 100 μl to each of two PCR tubes, and run them on the annealing program (“Adapt” on the PCR machine).
DNA quantification and dilution
Dilution to ≤200 ng/μL (usually, just a 10x dilution)
- Picogreen can accurately detect very small quantities of DNA, but is not accurate over 1 ng/μL. In the Picogreen assay, DNA is diluted 200X in solution, so DNA stock solution of up to 200 ng/μL can be quantified.
- Our DNA extraction protocol yields concentrations of up to 2 μg/μL (2000 ng/μL). Therefore, we need to dilute 10X to ensure that we are in the range that can be measured with Picogreen.
- Take a 96 well PCR plate, and add 18 μL 10 mM Tris or TE to 88 wells (11 columns).
- Using a spreadsheet that records which sample goes in which well, add 2 μL of DNA extraction to the 18 μL of buffer. You can quantify 88 samples on one plate.
Quantify your ≤200 ng/μL dilution plate using Picogreen:
- Take the tube of bright orange Picogreen reagent out ahead of time to thaw. Wrap it in aluminum foil to protect it from light. It is in DMSO instead of water, so it takes a long time to thaw and will immediately freeze solid if you put it on ice.
- The Quant-iT Picogreen kit comes with a lambda DNA standard at 100 μg/mL. Dilute some of the 20X TE that comes with the kit to 1X TE, and use it to make a 2 μg/mL dilution of the lambda DNA. (1:50 dilution.) (Alternatively, I have made a 8 μg/mL stock that can be diluted 4X at the time the standard column is set up.)
- For one plate (88 samples, 8 standards) make up 20 mL of 1X TE. (1 mL of the TE that comes with the kit, plus 19 mL sterilized filtered water.)
- The plate you need for the assay is a black, flat-well plastic plate. (Corning makes these.)
- Set up a standard curve in column 1 (or column 12, doesn’t matter). Pipette 100 ul of TE into wells B-H. Add 100 ul of your 2 ug/ml lambda standard each to well A and B. Pipette well B up and down to mix, then transfer 100 ul to well C. Pipette well C up and down to mix, then transfer 100 ul to well D. Continue through well G, and leave well H as a blank. (After mixing well G, you will simply throw out 100 ul.)
- Add 99 μL TE to the other 88 (or however many samples you are doing) wells . Add 1 ul of ≤200 ng/μL sample DNA (from the 10X dilution plate) to each well.
- Add 50 μL of Quant-iT reagent to 10 mL of 1X TE. This solution needs to be used within a few hours, even if it is protected from light. Add 100 μL of the solution to each well (both sample, standard, and blank).
- Picogreen bonded to dsDNA has an excitation maximum at 480 nm and emission maximum at 520 nm. The plate readers in IGB (BioTek Synergy HT) probably already have a picogreen program on them.
If you need to re-make the picogreen program, use the screenshots below:
- Read fluorescence intensity on the plate reader, and export it to Microsoft Excel.
- Make a scatterplot of fluorescence intensity of the standard vs. the standard concentration. Given that the samples were diluted 2000X, the standard concentration is multiplied by 200:
- Well A 2000 ng/μL
- Well B 1000
- Well C 500
- Well D 250
- Well E 125
- Well F 62.5
- Well G 31.25
- Well H 0
- In Excel, fit a trendline to the scatterplot and display the equation on the chart. Use this equation to estimate the concentration of the samples.
In most cases, the concentration estimate via Picogreen should be lower than the concentration estimate via Nanodrop. This is because Nanodrop measures DNA + RNA, whereas Picogreen only measures DNA.
Based on the Picogreen concentration estimates, dilute the DNA to 50 ng/μL in 10 mM Tris (and 0.1 mM EDTA, optional).
Notes for samples of concentration lower than 50 ng/μL:
- If you have a lot of samples that are 30-50 ng/μL, you can dilute all samples for your library to 30 ng/μL or 40 ng/μL instead of 50. The amount of adapter that you add at the ligation step (see below) should be reduced proportionately.
- For samples in the 10-50 ng/μL range, a cheap and efficient way to concentrate them is by isopropanol precipitation:
- Combine 200 μL DNA sample, 20 μL 3M sodium acetate, and 200 μL isopropanol.
- Mix well by inversion. Place in the freezer for at least an hour.
- Spin down 10 minutes in the centrifuge.
- Pour off the liquid, taking care to keep the pellet.
- Add 200 μL 70% ethanol to rinse. Invert a few times.
- Spin down 1 minute, then pour off the ethanol, again being careful not to lose the pellet.
- Allow to dry on the lab bench.
- Resuspend the DNA in 20 μL TE.
- Requantify with Picogreen, then dilute to 50 ng/μL.
Restriction digestion and ligation
Restriction digestion master mix:
Ingredient |
For one sample |
For one plate |
50 ng/ul DNA |
5 ul |
– |
10X NEBuffer 4 (or CutSmart) |
1.5 ul |
165 ul |
PstI-HF, 20,000 U/mL |
0.25 ul |
27.5 ul |
MspI, 20,000 U/mL |
0.25 ul |
27.5 ul |
Nuclease-free water |
8 ul |
880 ul |
(I have also used DNA at a concentration of 100 ng/ul because that was what Keck wanted for GoldenGate, so then I used 2.5 ul DNA and 10.5 ul water.)
Do this in a 96-well plate. Pipette the DNA into the wells and then add 10 ul of master mix to everything. Pick one well that will not have DNA in it. This will be an important control later on to demonstrate that this library was not contaminated with another library (which will have a different empty well).
Run the Digest program on the PCR machine: 3 hours at 37°C, then 20 minutes at 80°C.
Using a multichannel pipette, add 1.5 μL of 0.1 μM PstI adapters to their corresponding wells on the digestion plate. (Do add the adapter corresponding to the well that has no DNA in it.)
Ligation master mix, keep on ice until use:
Ingredient |
For one sample |
For one plate |
10X Ligase buffer with ATP |
1 ul |
110 ul |
10 μM MspI adapter |
0.5 ul |
55 ul |
10 mM ATP |
1.5 ul |
165 ul |
T4 Ligase, 2M U/mL |
0.1 ul |
11 ul |
Nuclease-free water |
5.4 ul |
594 ul |
Add 8.5 μL of ligation master mix to each well of the digestion plate.
Run on the “ligate” program on the PCR machine: 2 hours at 25°C, 20 minutes at 65°C.
Cleanup and amplification
- Using a multichannel pipette and a PCR 8-well strip tube, pool all the columns together, adding 5 μL from each well of the plate to the wells on the strip tube.
- Pipette the 60 μL out of each well on the strip tube into one 1.5 mL tube. Mix well so that all samples are combined evenly. Freeze or keep on ice.
- Pour a 2% agarose gel with ethidium bromide. Make it nice and deep; my recipe is 4 g agarose, 200 mL 1X TAE, and 10 μL ethidium bromide solution. Use a wide-toothed comb.
- Take 50 μL (or more depending on your well volume) of your pooled library and combine it with a loading dye that does not have bromophenol blue. I use 10 μL of a 6X loading dye containing 30% glycerol, 0.2% orange G, 10 mM Tris, and 1 mM EDTA.
- I recommend cleaning out your gel rig and putting in fresh TAE, since you especially want to avoid any contamination from other Illumina libraries.
- Run your ~60 μL of library plus loading dye on the gel. The lane with the library should have a lane of 100 bp ladder on either side of it. You can put multiple libraries on one gel, but leave several empty lanes between them.
- The gel doesn’t need to be run very long. I would go 20 minutes at 100 V, or until the ladder bands below 500 bp are distinguishable.
- The library should look like a smear. There may be some undigested DNA (a band in the 10’s of kb) but that is okay as long as most of the DNA is digested. There may also be a thick band of RNA and leftover adapter below 100 bp. (I have found that RNAse treatment removed most of that band but did not appear to improve DNA digestion.)
- Using a clean razor blade for each library, cut out the smear between 200 bp and 500 bp (if using SbfI, instead cut from 200 bp to 1000 bp). There should definitely be DNA visible in this range.
Three pooled ligations ready for gel extraction, with GoTaq Green loading dye
Pooled ligations when NEB orange dye is used
- Use the Qiagen gel extraction kit to purify the DNA out of this gel slice. Do include the optional steps of washing with QG after binding the DNA to the column, as well as letting the column sit in PE for 2-5 minutes before spinning (Phusion can handle contamination from agarose/salts, but KAPA HiFi cannot). Elute in the lower volume (30 μL EB).
- Run the Illumina PCR:
- 3 μL gel-extracted library
- 2 μL 10 μM forward + reverse Illumina primers (PCR1 and PCR2)
- 25 μL 2X Kapa Hi-Fi Master mix
- 20 μL nuclease-free water
- PCR program:
- 98°C 30 seconds
- 15 cycles of 98°C 10 seconds, 65°C 30 seconds, 72°C 30 seconds
- 72°C 5 minutes
- The first time you do this protocol, run 5 μL of the PCR product out on a 2% agarose gel. Look to see whether there is primer-dimer visible. If there is no primer-dimer visible, use the Qiagen PCR cleanup kit to purify the remaining 45 μL of PCR product.
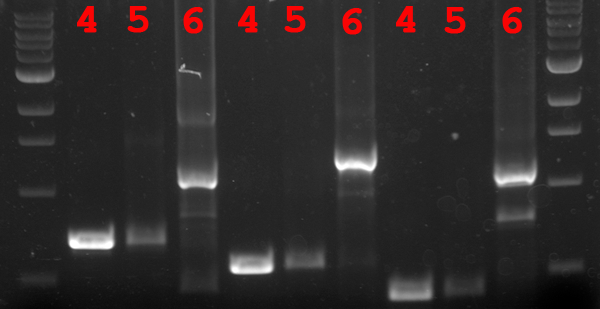
Nine libraries post-PCR, with GoTaq Green loading dye. A second gel (with space in between libraries) will be needed for extraction of the libraries, to eliminate the primer-dimer.
Amplified libraries, run with NEB orange dye, ready for gel extraction.
- If there is primer-dimer visible, run the remaining 45 μL of PCR product on a 2% agarose gel and extract the library (as was done pre-PCR). Follow the instructions in the Qiagen gel extraction kit as specified for sequencing. (After binding DNA to the column, do a wash with QG. When rinsing with PE, let sit for 2-5 minutes before spinning.) Typically I get primer-dimer, so I just do this extraction and skip the previous gel to test for primer-dimer.
Quality control
- Quantify the purified PCR product using the Picogreen protocol as above. Expected concentrations are in the 10’s of ng/μL.
- Make 4 μL of a 1 ng/μL dilution of the library, and submit it to the Functional Genomics center to run on a High Sensitivity DNA chip on the Bioanalyzer. There should be a smooth curve from around 200 to 500 bp. Any sharp peaks could indicate that the enzymes were cutting in a repetitive region of the genome, in which case it is best to choose different enzymes. Use the Bioanalyzer software to calculate the average fragment size.
- If there is primer-dimer remaining in the library, it will be visible as a sharp peak at a lower molecular weight than the broad peak for the library. (The library pictured below does not have primer-dimer.)
- Calculate the concentration of the PCR product in nM. Keck supplies a worksheet for this calculation. If [math]\displaystyle{ x }[/math] is the concentration in ng/μL, [math]\displaystyle{ y }[/math] is the average size in base pairs, and [math]\displaystyle{ z }[/math] is the concentration in nM, then [math]\displaystyle{ z = \frac{10^6*x}{649y} }[/math].
- Dilute the purified PCR product to 10 nM in EB (10 mM Tris).
- Give 20 μL of 10 nM library to the core facility (Keck). They will use real-time PCR to confirm a concentration of 10 nM. Using Illumina Hi-Seq, do one lane of 100 bp single-end reads.
Bioinformatics
Given the genome duplication present in Miscanthus, we have found that the UNEAK pipeline works well.
I have written an some R functions for importing the output of the UNEAK pipeline into adegenet or more generally into a numeric (0 and 2 for homozygote, 1 for heterozygote) matrix format in R.
I have also created TagDigger for cases where we already know what tag sequences we are looking for.
Notes
Please feel free to post comments, questions, or improvements to this protocol. Happy to have your input!
- List troubleshooting tips here.
- You can also link to FAQs/tips provided by other sources such as the manufacturer or other websites.
- Anecdotal observations that might be of use to others can also be posted here.
Please sign your name to your note by adding ”’*~~~~”’: to the beginning of your tip.
References and additional reading
This protocol was published in:
Lindsay V. Clark, Joe E. Brummer, Katarzyna Głowacka, Megan Hall, Kweon Heo, Junhua Peng, Toshihiko Yamada, Ji Hye Yoo, Chang Yeon Yu, Hua Zhao, Stephen P. Long, and Erik J. Sacks (2014) “A footprint of past climate change on the diversity and population structure of Miscanthus sinensis.” Annals of Botany. doi:10.1093/aob/mcu084. Free offprint
This protocol is based heavily upon that of:
Poland JA, Brown PJ, Sorrells ME, and Jannik J-L (2012) Development of high-density genetic maps for barley and wheat using a novel two-enzyme genotyping-by-sequencing approach. PLoS ONE 7(2):e32253. doi: 10.1371/journal.pone.0032253
Barcode sequences are published in:
Thurber CS, Ma JM, Higgins RH, and Brown PJ (2013) Retrospective genomic analysis of sorghum adaptation to temperate-zone grain production. Genome Biology 14:R68. doi: 10.1186/gb-2013-14-6-r68
Additional reading
- Baird NA, Etter PD, Atwood TS, Currey MC, Shiver AL, et al. (2008) Rapid SNP Discovery and Genetic Mapping Using Sequenced RAD Markers. PLoS ONE 3(10): e3376. doi:10.1371/journal.pone.0003376
- Catchen JM, Amores A, Hohenlohe P, Cresko W, and Postlethwait JH (2011) Stacks: building and genotyping loci de novo from short-read sequences. G3: Genes, Genomes, Genetics 1:171-182. doi: 10.1534/g3.111.000240
- Davey JL and Blaxter MW (2010) RADSeq: next-generation population genetics. Briefings in Functional Genomics 9(5):416-423. doi:10.1093/bfgp/elq031
- Davey, J. W., Cezard, T., Fuentes-Utrilla, P., Eland, C., Gharbi, K. and Blaxter, M. L. (2012), Special features of RAD Sequencing data: implications for genotyping. Molecular Ecology. doi: 10.1111/mec.12084
- Elshire RJ, Glaubitz JC, Sun Q, Poland JA, Kawamoto K, Buckler ES, and Mitchell SE (2011) A robust, simple Genotyping-by-Sequencing (GBS) approach for high diversity species. PLoS One 6(5): e19379. doi:10.1371/journal.pone.0019379
- Hohenlohe PA, Catchen J, Cresko WA (2012) Population Genomic Analysis of Model and Nonmodel Organisms Using Sequenced RAD Tags. In: Data Production and Analysis in Population Genomics, Pompanon F and Bonin A, eds. 235-260. doi:10.1007/978-1-61779-870-2_14
- Peterson BK, Weber JN, Kay EH, Fisher HS, Hoekstra HE (2012) Double Digest RADseq: An Inexpensive Method for De Novo SNP Discovery and Genotyping in Model and Non-Model Species. PLoS ONE 7(5): e37135. doi:10.1371/journal.pone.0037135
- Serang O, Mollinari M, Garcia AAF (2012) Efficient Exact Maximum a Posteriori Computation for Bayesian SNP Genotyping in Polyploids. PLoS ONE 7(2): e30906. doi:10.1371/journal.pone.0030906